NYTimes and Creature Cast: The Central Limit Theorem

My statistics teacher showed us this video in class about the Central Limit Theorem, which is the most important theorem in statistics. Basically, it states that with a large sample, the sampling distribution of the means is normally distributed. This is always the case, even when the sample is not originally distributed; the sample can be bimodal or even uniform.

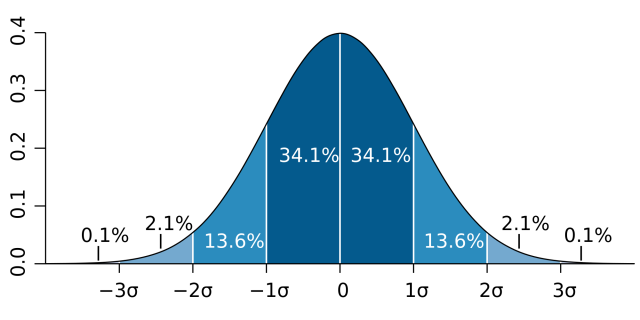
The normal curve, or bell curve, is one of the most recognizable distributions and the most common.  Just a refresher, this is what a normal curve looks like:
normal curve

The highest point of the curve is the mean, median, and mode of a sample. 68% of observations are within 1 standard deviation from the mean, with the standard deviation being the average variation from the mean. For example, if a newborn kitten weighs an average of 4 ounces with a standard deviation of 1 oz, then 68% of newborn kittens would be 3-5 oz. This would be under the assumption that newborn kitten weights are normally distributed. I have no idea if that’s true… I just really like kittens.

According to the Central Limit Theorem, if you take many samples of newborn kitten weight, the distribution should look like a normal curve, regardless of whether it actually is normally distributed.

Rather than explaining the Central Limit Theorem in depth, I would highly recommend the video by Creature Cast. The script is by Casey Dunn and Shuyi Chiou, and it was posted on the New York Times‘ YouTube channel in 2013.

The video explains the theorem so simply and with excellent graphics. Compared to other videos on the Central Limit Theorem, it’s much shorter (and more entertaining, who doesn’t love bunnies and dragons?) while still covering the fundamentals of the theorem. The explanation is clear and simple so that introductory statistics students, and even those who don’t have any statistics education, can understand and grasp the ideas.

If you’re a student who is struggling to understand the Central Limit Theorem or just someone looking to learn a little bit more about the world around them, this is the video for you!

Scientific American: Math at the Met

First blog post! So exciting! Just to give you all an idea of what’s to come, I’m a senior in high school who loves science. I think it’s important to make science accessible, meaning that science news is comprehendible and understandable for the general public or for anyone who’s interested in science- for example, high schoolers like me. Basically, this blog is for me to ramble about things I hope other science geeks will also enjoy (and turn some of you into science geeks!) while also compiling fairly easy-to-read articles for people interested in all different topics in science. Hopefully, now you know me a little better with this long introduction. As I said, I ramble. Onto the science!

Recently, I’ve started reading more articles from Scientific American. I think the publication does a really great job of covering news and addressing relevant issues while also featuring more fun, whimsical articles. One of these more unique articles is “Math at the Met” by Joseph Dauben and Majorie Senechal. This article is a great introduction to show how math is found in everyday life.

Essentially, the authors, both professors, give a tour of the Met with a little twist: math-focused art. No, there aren’t complex calculus equations on the borders of paintings. But there are numbers, spheres, magic squares, and dice. Personally, my favorite is the magic square in “Melencolia I” by artist Albrecht Durer. The numbers in the rows, columns, and diagonals all add up to ’34’, and numbers 1-16 are represented once.

“Math at the Met” also features several board games and dice, some of which are similar to what we see today.

“Math at the Met” is a quick tour of a fantastic museum through a lens we don’t normally look at the world. For a lot of people, math was that subject that seemed like it had nothing applicable in life, maybe besides taxes. But math creeps into our lives in simple ways, even through a game of cards as seen in Cézanne’s “Les Quatres joueurs de cartes”. This article also bridges a gap between art and science. We think of art as a creative endeavor while science is technical and analytical, yet here, we see both subjects blending together in a way that’s enjoyable.

I highly recommend this article; it illustrates the fun parts of math, and if you’re in New York sometime, you have an afternoon planned for you!